


What are Market Indicators?
Last Updated On -30 Jul 2026
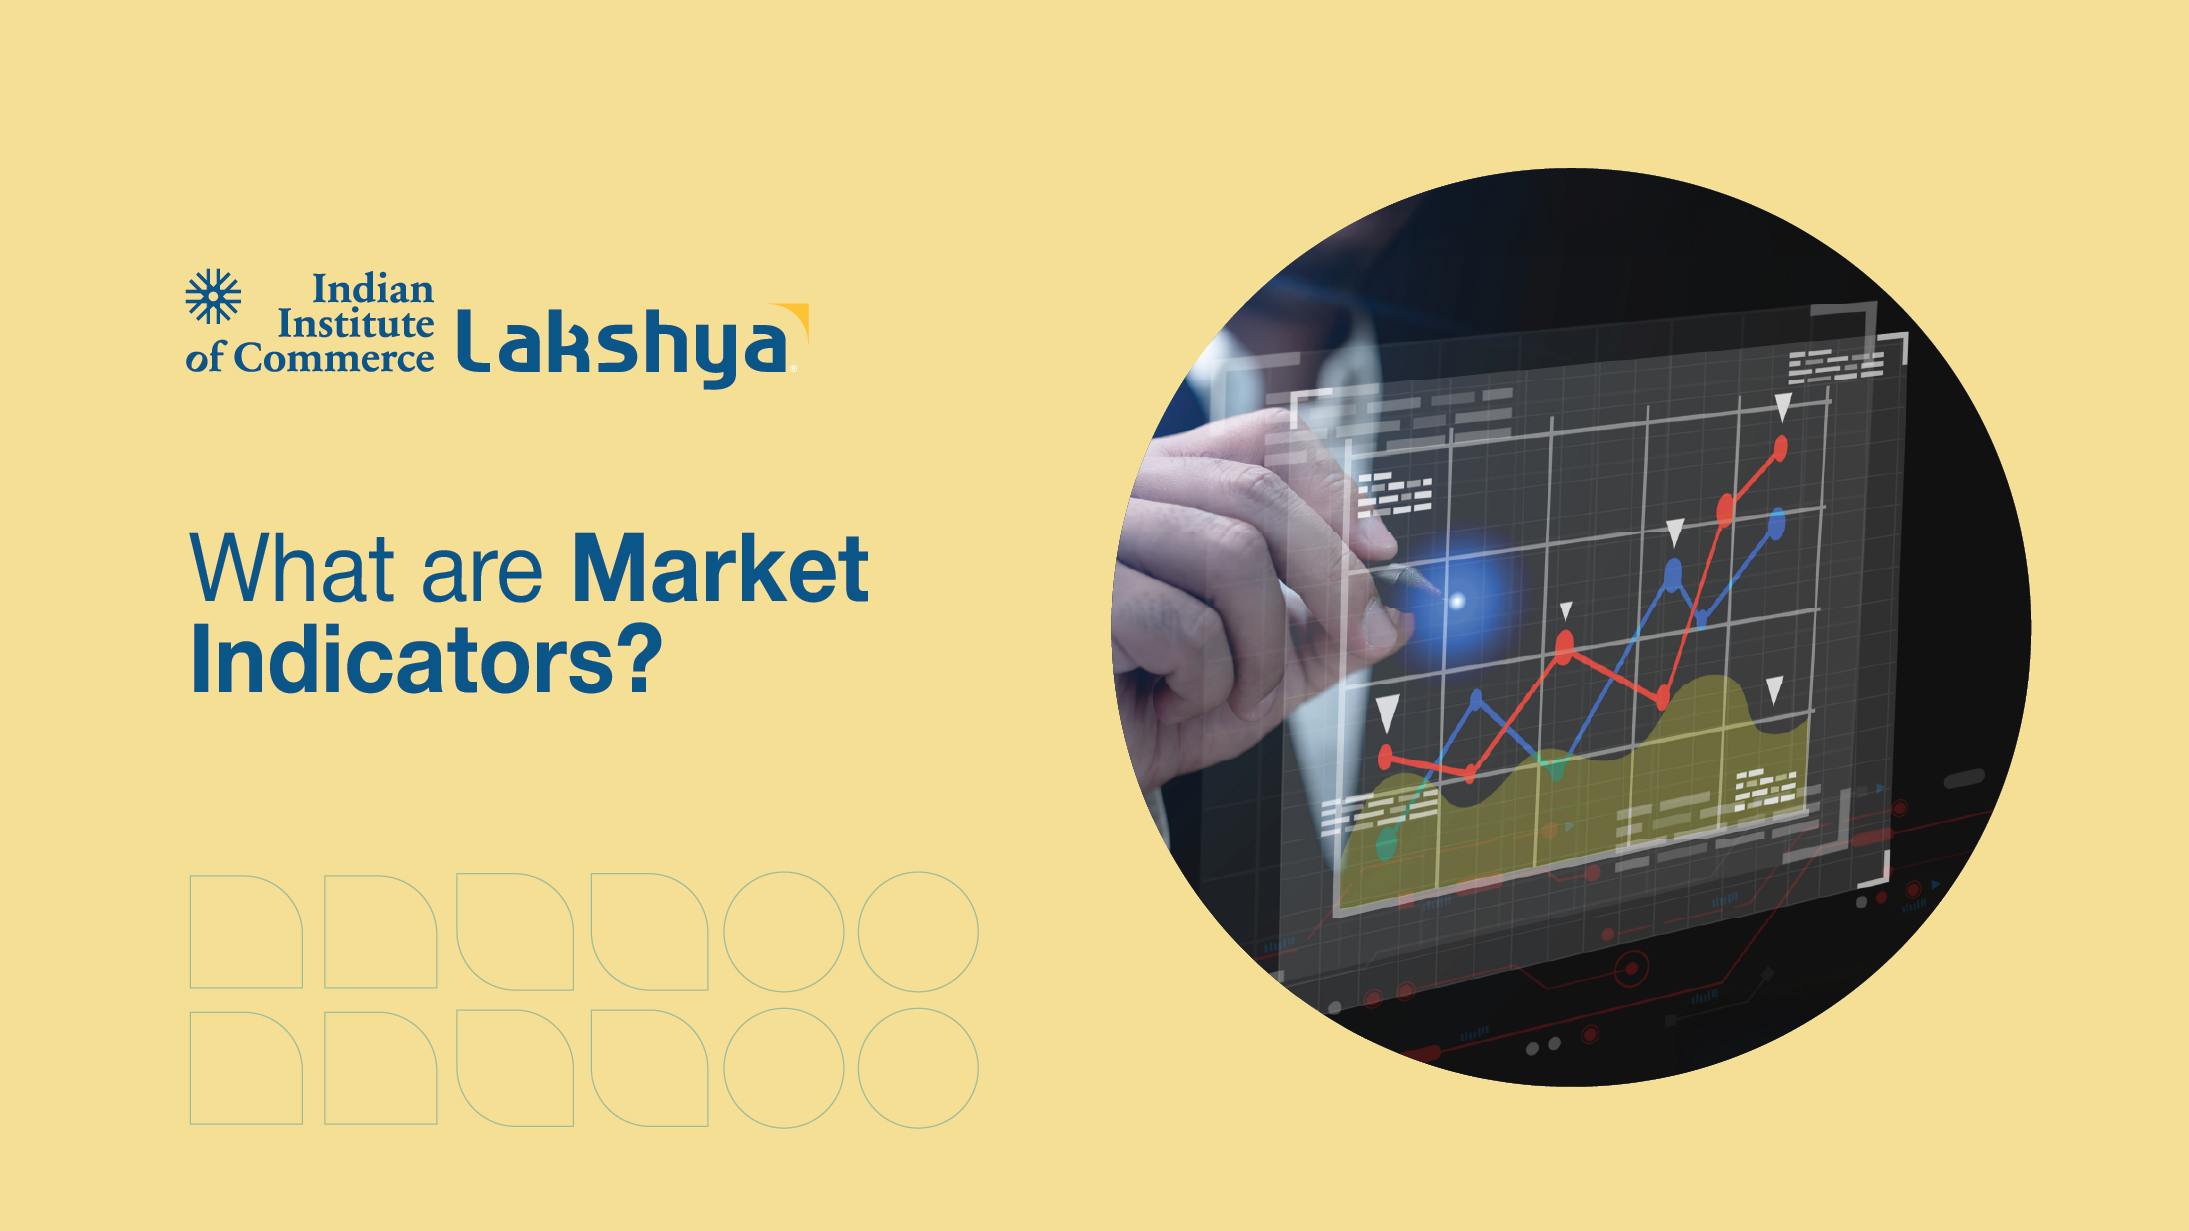
Market indicators are statistical tools and financial measurements used to analyze the performance and direction of financial markets. These indicators help investors, traders, analysts, and businesses understand market trends, predict price movements, and make informed investment decisions.
Market indicators are widely used in stock markets, commodity markets, and financial analysis to evaluate economic conditions and investor sentiment. They provide valuable information about whether the market is growing, declining, stable, or highly volatile.
For commerce and finance students, understanding market indicators is essential because they are commonly used in investment analysis, stock trading, portfolio management, and economic forecasting. This blog provides a detailed explanation of market indicators, their types, functions, and importance in the financial system.
History of Market Indicators
Market indicators developed as financial markets expanded and investors required tools to analyze stock performance and economic trends. In the early stages of stock trading, investors mainly depended on company reports and market rumors to make investment decisions.
With the growth of organized stock exchanges such as the Bombay Stock Exchange (BSE) and the New York Stock Exchange (NYSE), financial experts began creating indicators to measure overall market performance. One of the most famous market indicators, the Dow Jones Industrial Average (DJIA), was introduced in 1896 in the United States.
In India, stock market indices such as Sensex and Nifty 50 became important indicators for measuring market performance. Today, technological advancements and digital trading platforms provide investors with real-time market indicators, helping them make faster and more accurate decisions.
Key Features of Market Indicators
Market indicators provide useful information for analyzing financial markets and economic conditions.
Here are the key features of market indicators:
- Market indicators help measure market trends and performance.
- They provide information about price movements and investor sentiment.
- Indicators assist investors in making informed financial decisions.
- Market indicators are used in technical and fundamental analysis.
- They help identify risks and investment opportunities.
- Indicators can measure economic growth, inflation, and market volatility.
- Most indicators are based on statistical data and mathematical calculations.
- Market indicators are widely used in stock trading and portfolio management.
Types of Market Indicators
There are different types of market indicators used for analyzing market conditions and investment opportunities.
The major types of market indicators are listed below:
- Stock market indices
- Economic indicators
- Technical indicators
- Volume indicators
- Volatility indicators
- Momentum indicators
- Trend indicators
- Sentiment indicators
Common Market Indicators and Their Functions
Different market indicators serve different purposes in financial analysis and investment decision-making.
Let us look at some common market indicators and their functions:
Sensex
Sensex is the benchmark index of the Bombay Stock Exchange (BSE) that measures the performance of the top 30 companies listed on the exchange.
Nifty 50
Nifty 50 is the benchmark index of the National Stock Exchange (NSE), representing the top 50 companies across different sectors.
Gross Domestic Product (GDP)
GDP measures the total value of goods and services produced in a country and reflects economic growth.
Inflation Rate
The inflation rate indicates the increase in prices of goods and services over time, affecting purchasing power and investments.
Moving Average
A moving average is a technical indicator used to identify market trends by calculating the average price over a specific period.
Relative Strength Index (RSI)
RSI is a momentum indicator used to determine whether a stock is overbought or oversold.
Volume Indicator
Volume indicators measure the number of shares or securities traded in the market, showing the strength of price movements.
Volatility Index (VIX)
The VIX measures market volatility and investor fear or uncertainty in the market.
How do Market Indicators work?
Market indicators work by collecting and analyzing financial, economic, and trading data to identify patterns and trends in the market. Investors and analysts use these indicators to understand the direction and strength of market movements.
Let us look at the working process of market indicators:
- Financial data such as stock prices, trading volumes, and economic reports are collected.
- Indicators apply statistical formulas and calculations to analyze the data.
- The results are displayed in charts, graphs, or index values.
- Investors study these indicators to identify buying or selling opportunities.
- Technical analysts use indicators to predict short-term market movements.
- Economic indicators help governments and businesses evaluate economic conditions.
- Market indicators assist in managing investment risks and portfolio strategies.
Career Opportunities Related to Market Indicators
Knowledge of market indicators is important for many careers in finance, stock markets, and investment management. Professionals in these fields regularly use indicators to analyze market conditions and make financial recommendations.
Here is a list of professions related to market indicators:
- Financial Analyst
- Stock Market Analyst
- Investment Banker
- Portfolio Manager
- Equity Research Analyst
- Risk Analyst
- Wealth Manager
- Technical Analyst
Key Differences between Economic Indicators and Technical Indicators
Economic indicators and technical indicators are both used in market analysis, but they focus on different aspects of financial markets.
The Key Differences between Economic Indicators and Technical Indicators:
Economic Indicators |
Technical Indicators |
|
Measure the overall economic performance |
Analyze stock price movements and trading patterns |
|
Based on economic data such as GDP and inflation |
Based on price, volume, and market trends |
|
Used for long-term economic analysis |
Used mainly for short-term trading decisions |
|
Help understand economic conditions |
Help identify market entry and exit points |
|
Examples: GDP, inflation, unemployment rate |
Examples: RSI, moving average, MACD |
Importance of Market Indicators
Market indicators play a vital role in helping investors, businesses, and governments understand financial and economic conditions. They improve decision-making and reduce uncertainty in the market.
Let us look at the importance of market indicators:
- Market indicators help investors make informed investment decisions.
- They provide insights into economic growth and financial stability.
- Indicators help identify market trends and price movements.
- They assist in reducing investment risks and uncertainties.
- Market indicators support portfolio management and financial planning.
- Governments use economic indicators for policy-making and economic planning.
- Businesses use indicators to analyze market conditions and future opportunities.
See Also
Frequently Asked Questions (FAQs)
What are market indicators?
Market indicators are statistical tools and measurements used to analyze financial markets, economic conditions, and investment trends.
What is the purpose of market indicators?
The purpose of market indicators is to help investors and analysts understand market trends, predict movements, and make informed decisions.
What are examples of market indicators?
Examples of market indicators include Sensex, Nifty 50, GDP, inflation rate, RSI, and moving averages.
Are market indicators useful for investors?
Yes, market indicators help investors analyze risks, identify opportunities, and make better investment decisions.
Related Articles


Learn Anytime, Anywhere, Download the Lakshya App.
Structured lessons, expert mentorship, and performance insights — built for serious commerce aspirants.

