


Why is Demand Curve Downward Sloping?
Last Updated On -23 Jul 2026
Demand acts as a driving force in the market, influencing the price and production of goods. It is an important economic concept; a consumer's needs or wants decide the product's nature. It offers businesses an opportunity to stay innovative and young minds to get into entrepreneurship and create a revolution in the market. The demand curve, a graphical representation of the relationship of goods and services with the demand of quantity, is a fundamental visual in economics.
What is a Demand Curve?
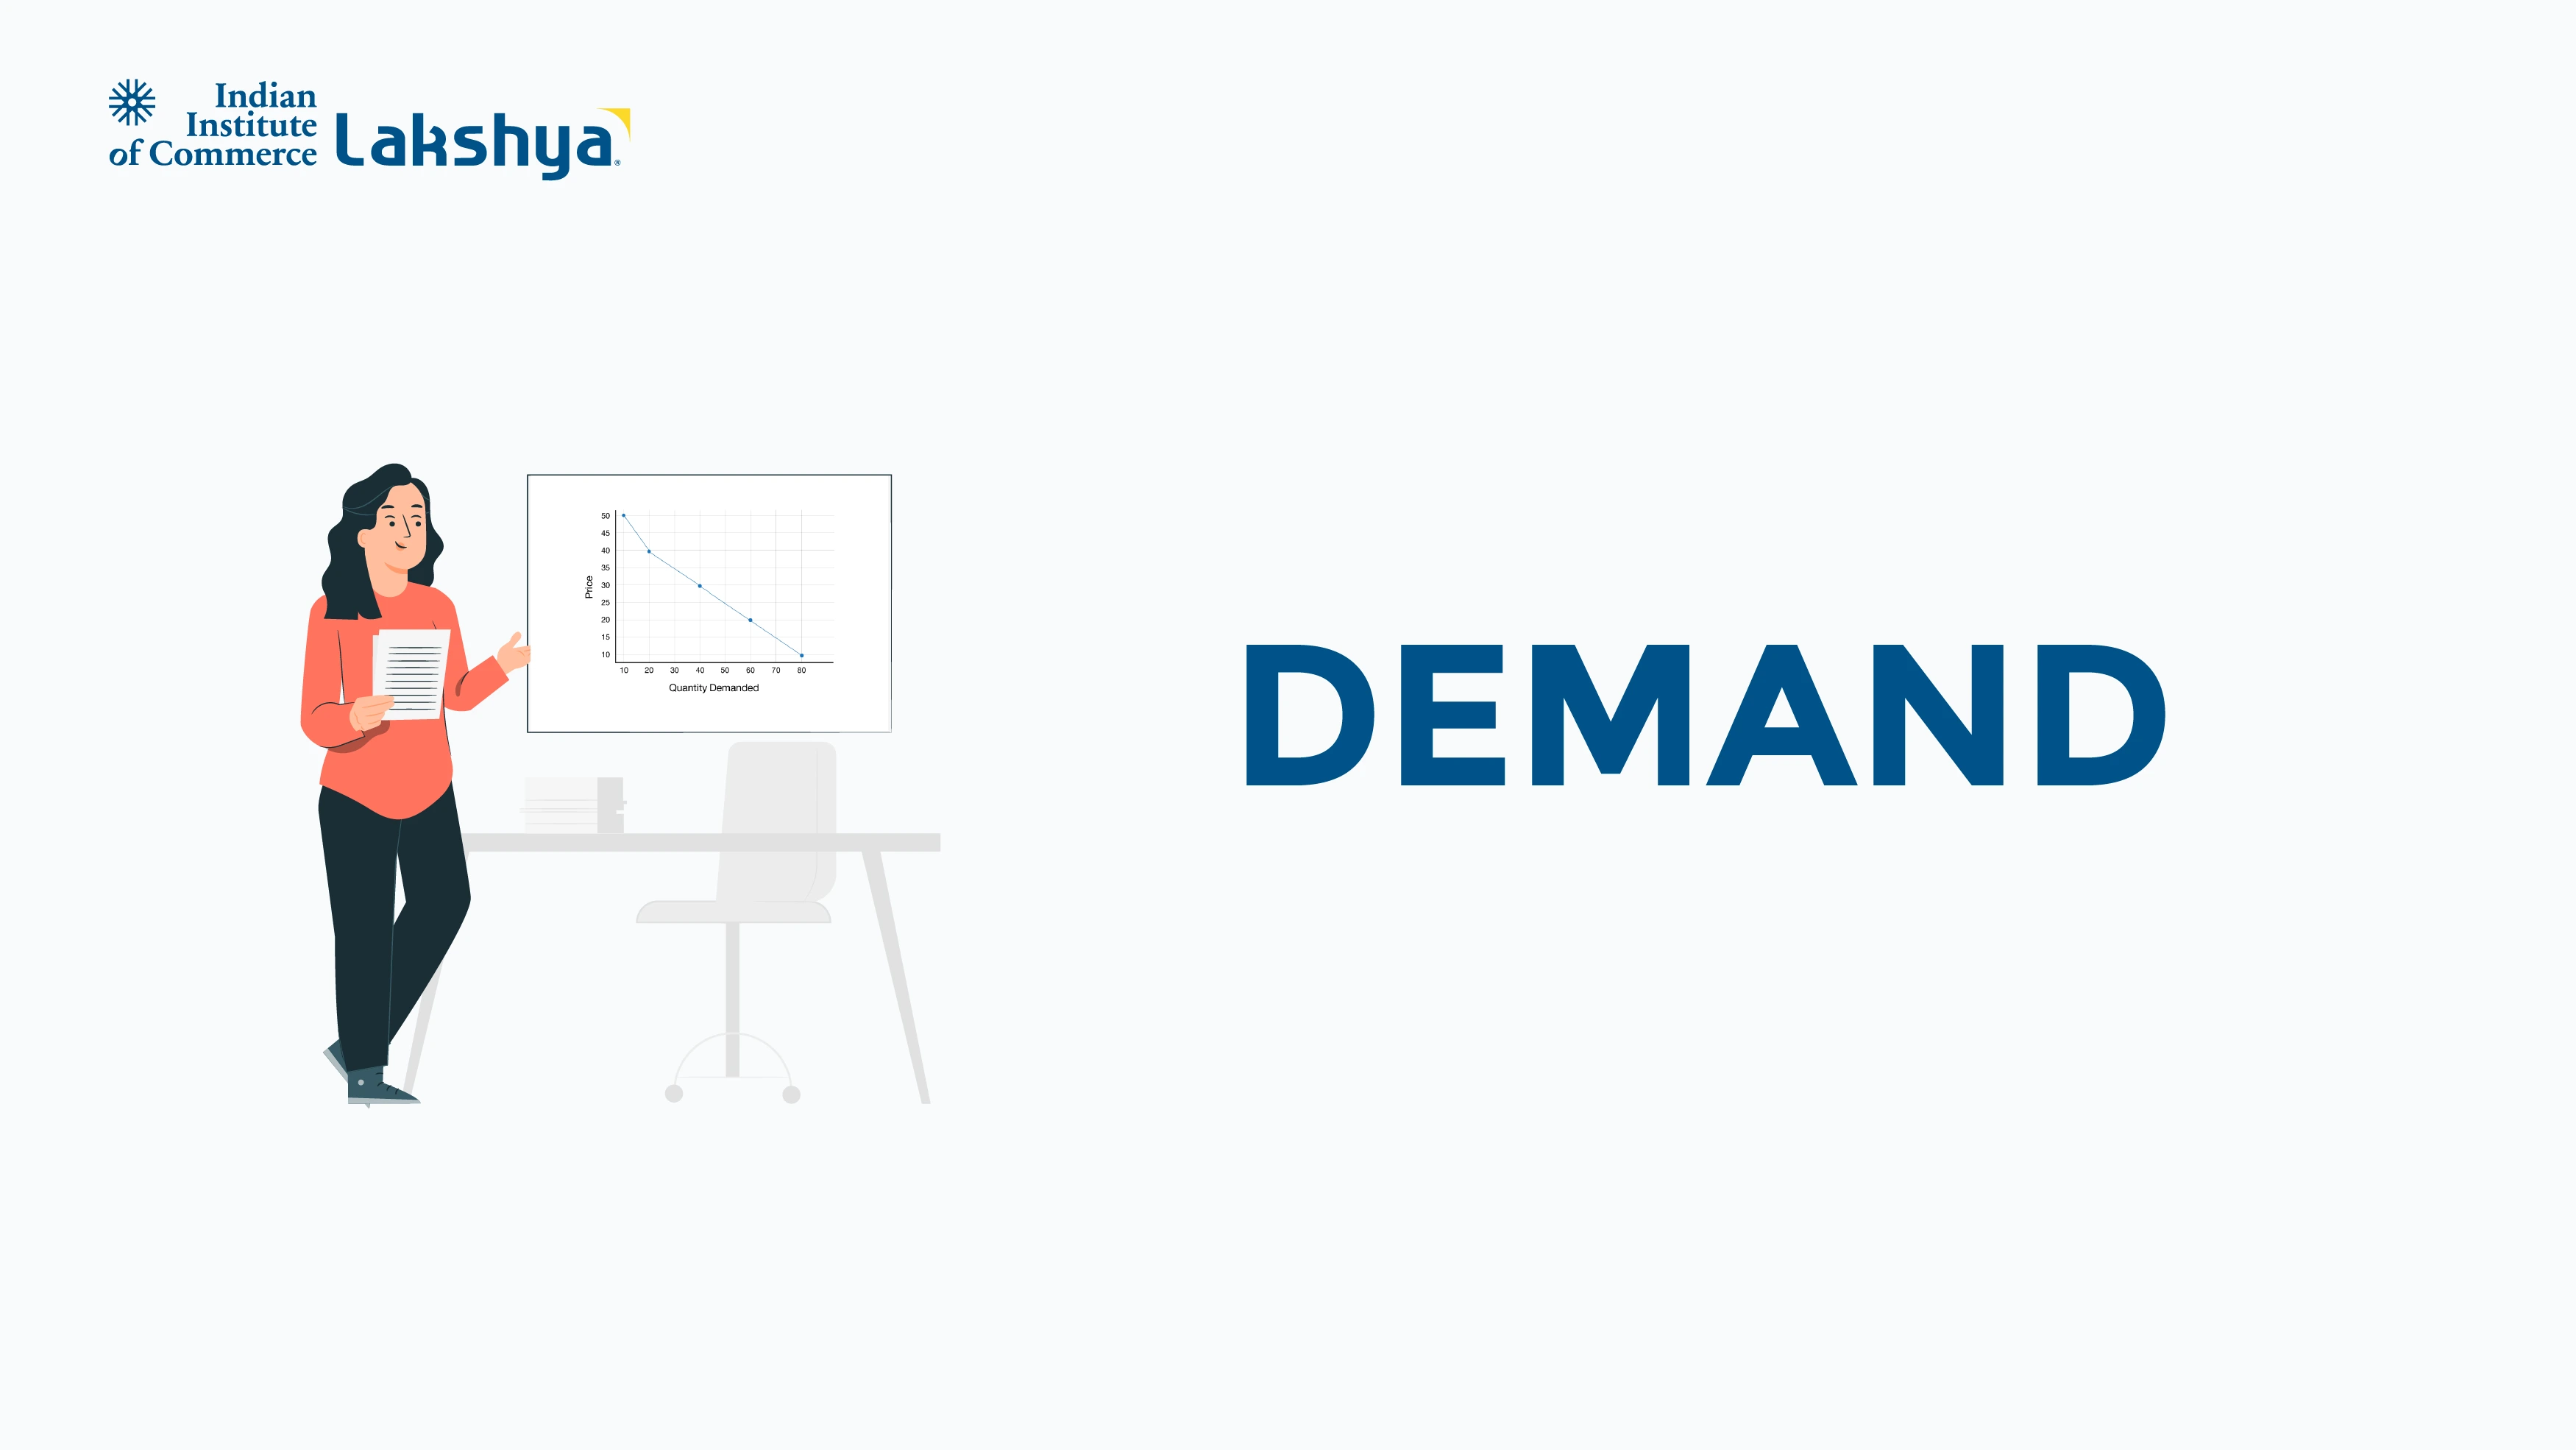
The demand curve is a graphical representation of the relationship between the price and quantity of the goods consumers demand. In simpler terms, if the cost of a product falls, the demand for the product increases. The demand curve usually slopes downward from the left to right, pointing towards an inverse relationship between the price and quantity. So, when the price falls, its quantity demanded rises, and vice versa.
- Price and demand have an inverse relationship, i.e., with the price increase, the demand decreases.
- The demand curve slopes downward from left to right, indicating a negative relationship.
- The normal demand curve is a downward slope representing the law of demand: decrease in price, increase in demand. The slope is negative, moving from the top left to the bottom right corner.
The Key Reasons for Downward Sloping Demand Curve
The downward sloping demand curve is an essential topic in economics. It shows the fundamental human behaviour which is the tendency to lean towards more consumption once the price starts to fall. This can result from a psychological satisfaction in a real-world financial situation or something else. This concept provides an understanding of the pricing strategies, market dynamics and consumer behaviour.
The key reasons for the Downward Sloping Demand Curve are:
1. The Law of Diminishing Marginal Utility
The most important reason for the downward sloping demand curve is the law of diminishing marginal utility. When the consumer consumes more units of goods and services, an additional satisfaction or utility from each additional unit decreases. Since each unit gives less satisfaction, the consumer is willing to pay less for each unit. This provides a deeper insight into the consumer equilibrium utility analysis.
For example, the first slice of orange you eat when you are hungry provides great satisfaction. The second slice still tastes good, but maybe a little less satisfying, and by the third or fourth slice the satisfaction decreases. So, you will buy more slices only when the price decreases.
This decrease in the marginal utility leads to consumers to buy more only when the price decreases, which makes the demand curve slope downwards.
2. Substitution Effect
The substitution effect is when the price of a good falls, then it becomes relatively cheaper in comparison to other substitute goods. As a result, consumers are more likely to buy the cheaper goods than the expensive substitute. This increases the quantity demanded of the lower-priced item.
For example, when the price of tea falls, and the substitute goods price, which is coffee, remains the same, some coffee drinkers might shift to tea, increasing the demand for tea.
This substitution in goods caused an increase in demand, which contributed to the downward slope.
3. Income Effect
The income effect accounts for psychological and economic reasons. If the price of a good decreases then the purchasing power of the consumer’s income increases. It reflects an increase in the income which allows them to buy more goods. The actual income of the consumer might or might now have changed.
For example, when a pair of jeans that usually cost INR 3000, is now available for INR 2000, a consumer might use the INR 1000 saved for some other purpose. This increase in purchasing power results in increased quantity demanded.
The income effect leads to a high quantity demand at a low price.
4. Arrival of New Buyers
When the price of goods or services falls, it becomes affordable to a large pool of consumers. This includes those who were previously priced out of the market. This provides a broad horizon to the consumer base and increases the total demand in the marketplace.
For example, a washing machine that costs INR 20,000 may only appeal to a high income pool of customers. When the price falls to INR 15,000, the middle-income buyers may now afford it, increasing the number of buyers and this increases the demand.
This arrival of new buyers contributes to the downward slope of the demand curve by adding new buyers at a low price point.
5. Multiple Use of a Commodity
There are a few goods which have multiple uses, and once the multiple use comes into the picture the demand increases than usual. The consumption expands when the price falls. As the price decreases, consumers might start using the goods for secondary or less urgent needs, which increases the demand.
For example, electricity at a higher price, might be used only for essential purposes like lighting. At a low price, people use it for heating, air conditioner, or running different appliances.
This increased use of commodities increases the overall quantity demanded, which contributes to the downward slope of the curve.
Key Exceptions to the Downward Sloping Demand Curve
There are a few circumstances where the demand curve might be downward sloping but in exceptional cases in contrast to the usual causes. These exceptions are rare and are limited to only a few cases. However, to understand the demand curve completely, getting to know these cases is important.
The Key Exceptions to the Downward Sloping Demand Curve are:
- Giffen Goods: These are the goods which are inferior and a rise in price might lead to an increase in demand due to the strong income effects
- Veblen Goods: The luxury items where the prices are high,however it makes the goods more desirable to consumers because of the status symbol.
- Speculative Demand: When consumers expect the prices to rise further, they tend to buy more at even higher prices.
Practice Questions & Answers for Downward Sloping Demand Curve
The Law of Attraction: Why the Demand Curve Slopes Downward
In the marketplace, price and quantity play a never-ending game of tug-of-war. This relationship is captured by the Demand Curve, a fundamental tool used by economists and business leaders to predict consumer behavior. At IIC Lakshya, we teach our CA and CMA students that the downward slope of this curve is not just a mathematical rule; it is a reflection of human psychology and financial reality.
Explore More
Get the clarity you’ve been searching for—read now our Commerce Topics For 11th and 12th!
Frequently Asked Questions (FAQs)
What is the law of demand?
“As the price of a good increase, the quantity demanded increases, assuming all the other factors remain constant, " as the law of demand states.
- Inverse Relationship: The price and demand move in opposite directions
- Demand curve: The slope moves from left to right
For example, if the price of a smartphone decreases, more people will buy it.
How does the future price expectation affect demand?
When consumers expect the pricing to increase in the future, the demand for the product will go up in the present time. Conversely, if the pricing is likely to drop in the future, there is a delay in the demand for the product.
How does the marginal utility decrease with each unit that is consumed?
The marginal utility decreases because when a consumer consumes more goods and services, an additional satisfaction or utility from each additional unit decreases. Since each unit gives less satisfaction, the consumer is willing to pay less for each unit.
Can a demand curve slope upwards?
In rare cases like Giffen goods or Veblen goods, the demand curve might slope upwards.
Related Articles


.webp)
.webp)
.webp)


.webp)

.webp)


.webp)
.webp)


.webp)


Learn Anytime, Anywhere, Download the Lakshya App.
Structured lessons, expert mentorship, and performance insights — built for serious commerce aspirants.

