


Production Possibility Curve
Last Updated On -14 May 2026

The production possibility curve (PPC) is a fundamental model in microeconomics. It is a graphical representation of several economic concepts, such as economies of scale, opportunity cost, efficiency of resources, and impact on the national income.
This blog comprehensively reviews the production probability curve and its significance in economics.
What do you mean by the Production Possibility Curve (PPC)?
From the microeconomics perspective, PPC is a graphical representation of the production options available to an individual related to the production. It provides knowledge about efficiency and growth via a model analyzing economic choices.
From the macroeconomics perspective, the PPC represents the production possibilities and options available to a nation for a definitive period. For instance, in a country with limited resources, the production of consumer goods (food items, clothing) and capital goods(machinery) has to be decided effectively.
PPC helps comprehend key economic questions such as how to utilize the resources sustainably and what goods and services production to prioritize.
Types of Production Possibility Curve
Based on the resource allocation and the cost involved, there are three main types of PPCs.
The type of curve drawn in the graph depicts the utilization of the resources.
How to interpret the PPC slope
- Consider the points on the curve
- The points inside the curve indicate underutilization of resources
- The points outside of the curve indicate an unattainable production level
Here are the three main types of production possibility curve
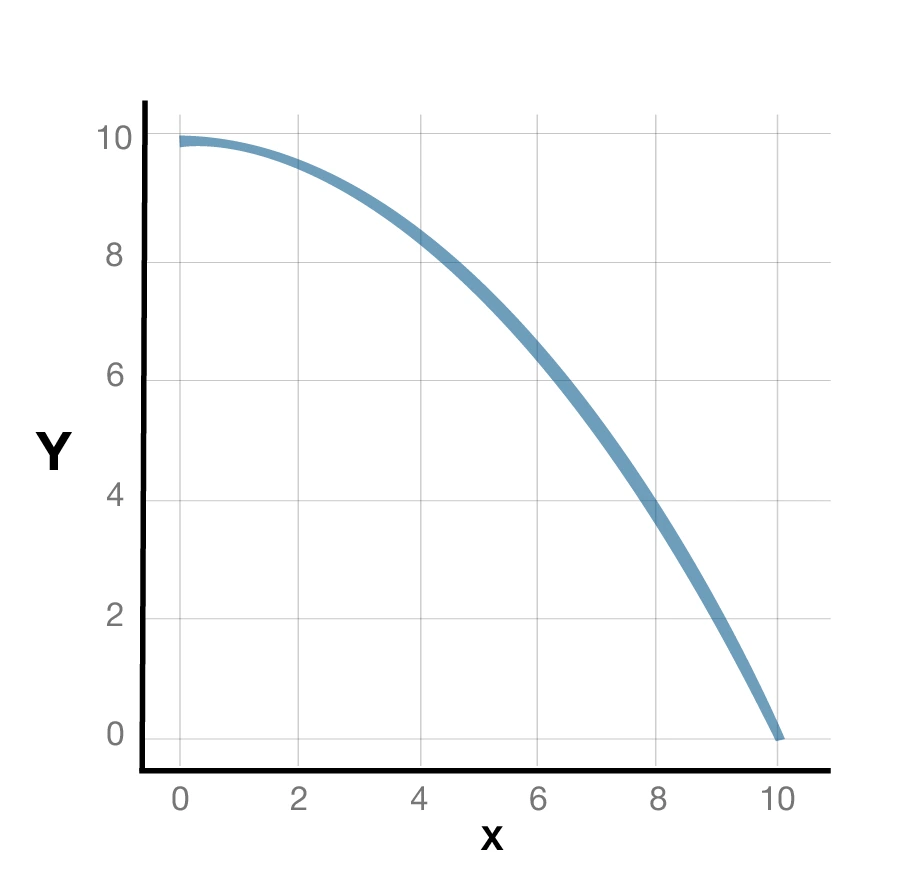
1. Concave PPC: Increasing Opportunity Cost
- This is the most common production possibility curve
- The curve is concave to the origin
- The graph depicts the production of one sound more than the other, thus decreasing the production of different goods.
- This happens on account of the insufficiency of resources
- For example, if there is an economic shift in resources from farming to industries, the farmers will not be efficient in a factory, thus increasing trade-off costs and decreasing production
Here is a graphical representation of the concave production possibility curve:
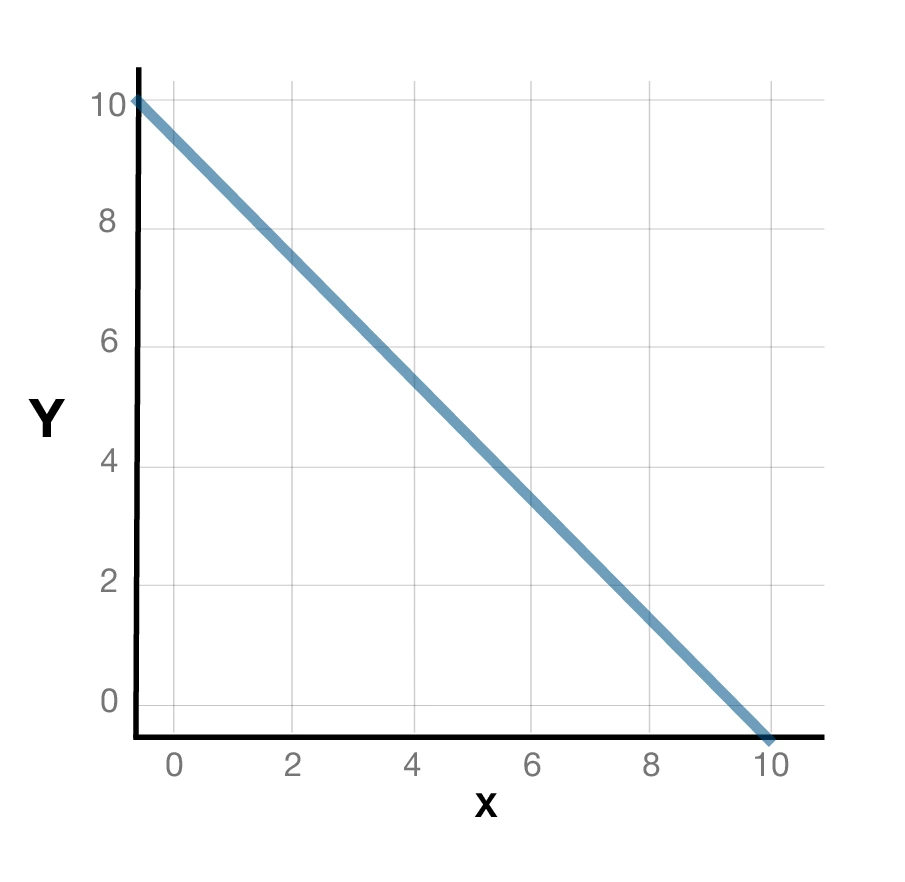
2. Straight-line PPC: Constant Opportunity Cost
- The straight-line PPC is downward sloping
- The graph depicts the constant opportunity cost at all points
- The resources are sufficient for the production of both goods
- For example, when a factory utilizes the same raw materials to produce two different goods.
Here is a graphical representation of the straight-line production possibility curve:
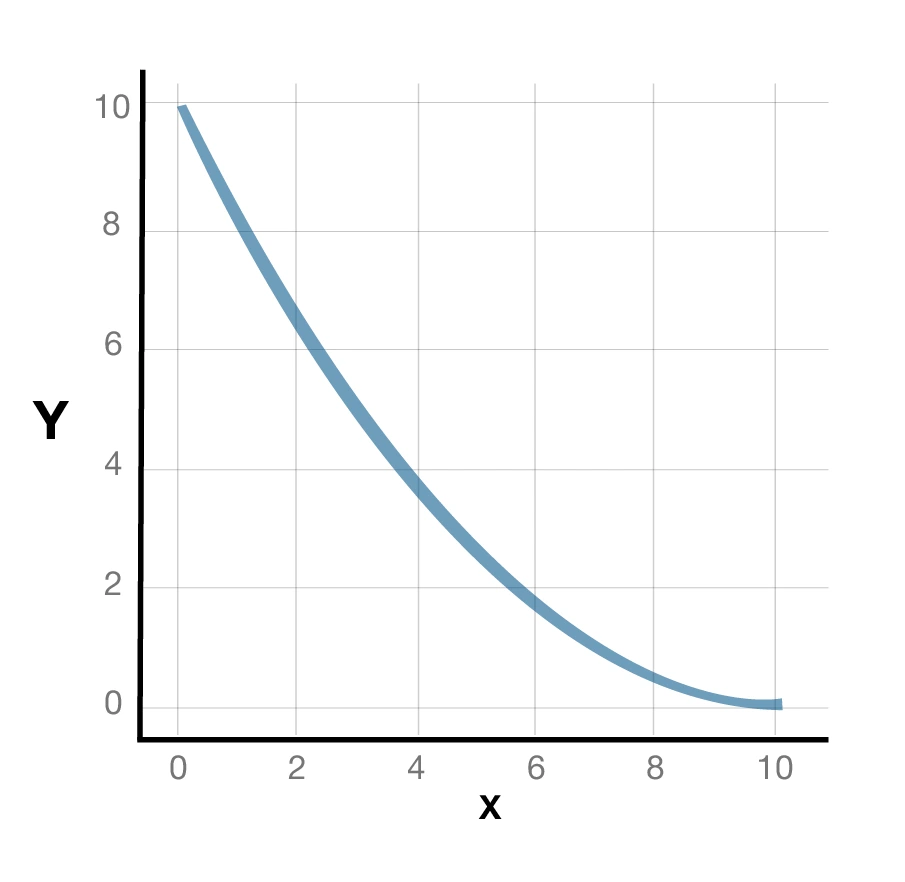
3. Convex PPC: Decreasing Opportunity Cost
- This is a rare case
- The graph is convex to the origin or bowed inward
- When the production shifts from one good to another, the opportunity cost decreases
- The resources become more beneficial for the second good after some time
- For instance, if an economy shifts from one industry to another after some time, the workers become efficient at the other work.
Here is a graphical representation for the convex production possibility curve:
Significance of Production Possibility Curve
In economics, scarcity of resources and trade-offs are essential concepts. The Production Possibility Curve is a graphical tool that helps policymakers understand resource allocation to produce services and goods.
The key reasons explaining the significance of the production possibility curve are:
- Helps in deciding resource allocation in sectors like healthcare and defense
- PPC models help companies determine the product lines
- Helps in making economic decisions for the environment
Clarify Economic Choices with Visual PPC Models
Gaining a precise understanding of the Production Possibility Curve is a vital step for students aiming to decode how resource allocation impacts national income and industrial growth. Visualizing the shifts between concave, straight-line, and convex curves allows you to better calculate opportunity costs—a skill that is directly applicable to strategic decision-making and corporate accounting. At IIC Lakshya, we deliver high-impact professional commerce coaching that transforms these theoretical graphs into practical business insights. Enhance your academic performance and prepare for a successful financial career by joining an institute where expert mentorship meets industry-leading study resources.
Explore More
- Planning Process
- How Humans Invented Accounting
- What are Subsidiary Books
- Organized and Unorganized Sector
Check out informative commerce blogs and surround yourself with extravagant knowledge on varied topics.
Frequently Asked Questions (FAQs)
What does the Production Possibility Curve (PPC) represent?
The PPC represents all possible combinations of two goods and services an economy can produce with the available resources.
What is the reason for the concave PPC?
The PPC is concave because the production shifts from one good to another, and more and more resources are needed. This graph depicts resources not being perfectly apt for producing both goods.
What is the reason behind outward and inward PPC?
The outward shift represents economic growth due to increased resources, whereas the inward shift represents economic decline.
Related Articles


.webp)
.webp)
.webp)


.webp)

.webp)


.webp)
.webp)


.webp)


Learn Anytime, Anywhere, Download the Lakshya App.
Structured lessons, expert mentorship, and performance insights — built for serious commerce aspirants.

