


Top Features of Indifference Curve Explained & Significance
Last Updated On -08 May 2026
If you are a student planning to pursue a career in the Chartered Financial Analyst (CFA) course, then you should know about the indifference curves explicitly. It is a prolific microeconomic theory that is necessary for professionals to understand budget constraints and basic consumer choice. Let’s learn more.
What is an Indifference Curve?
An indifference curve is one of the economic theories that is used to analyse choice behavior and preferences of a consumer. It reflects a combination of two goods, both of which are capable of offering the same level of satisfaction to the consumers.
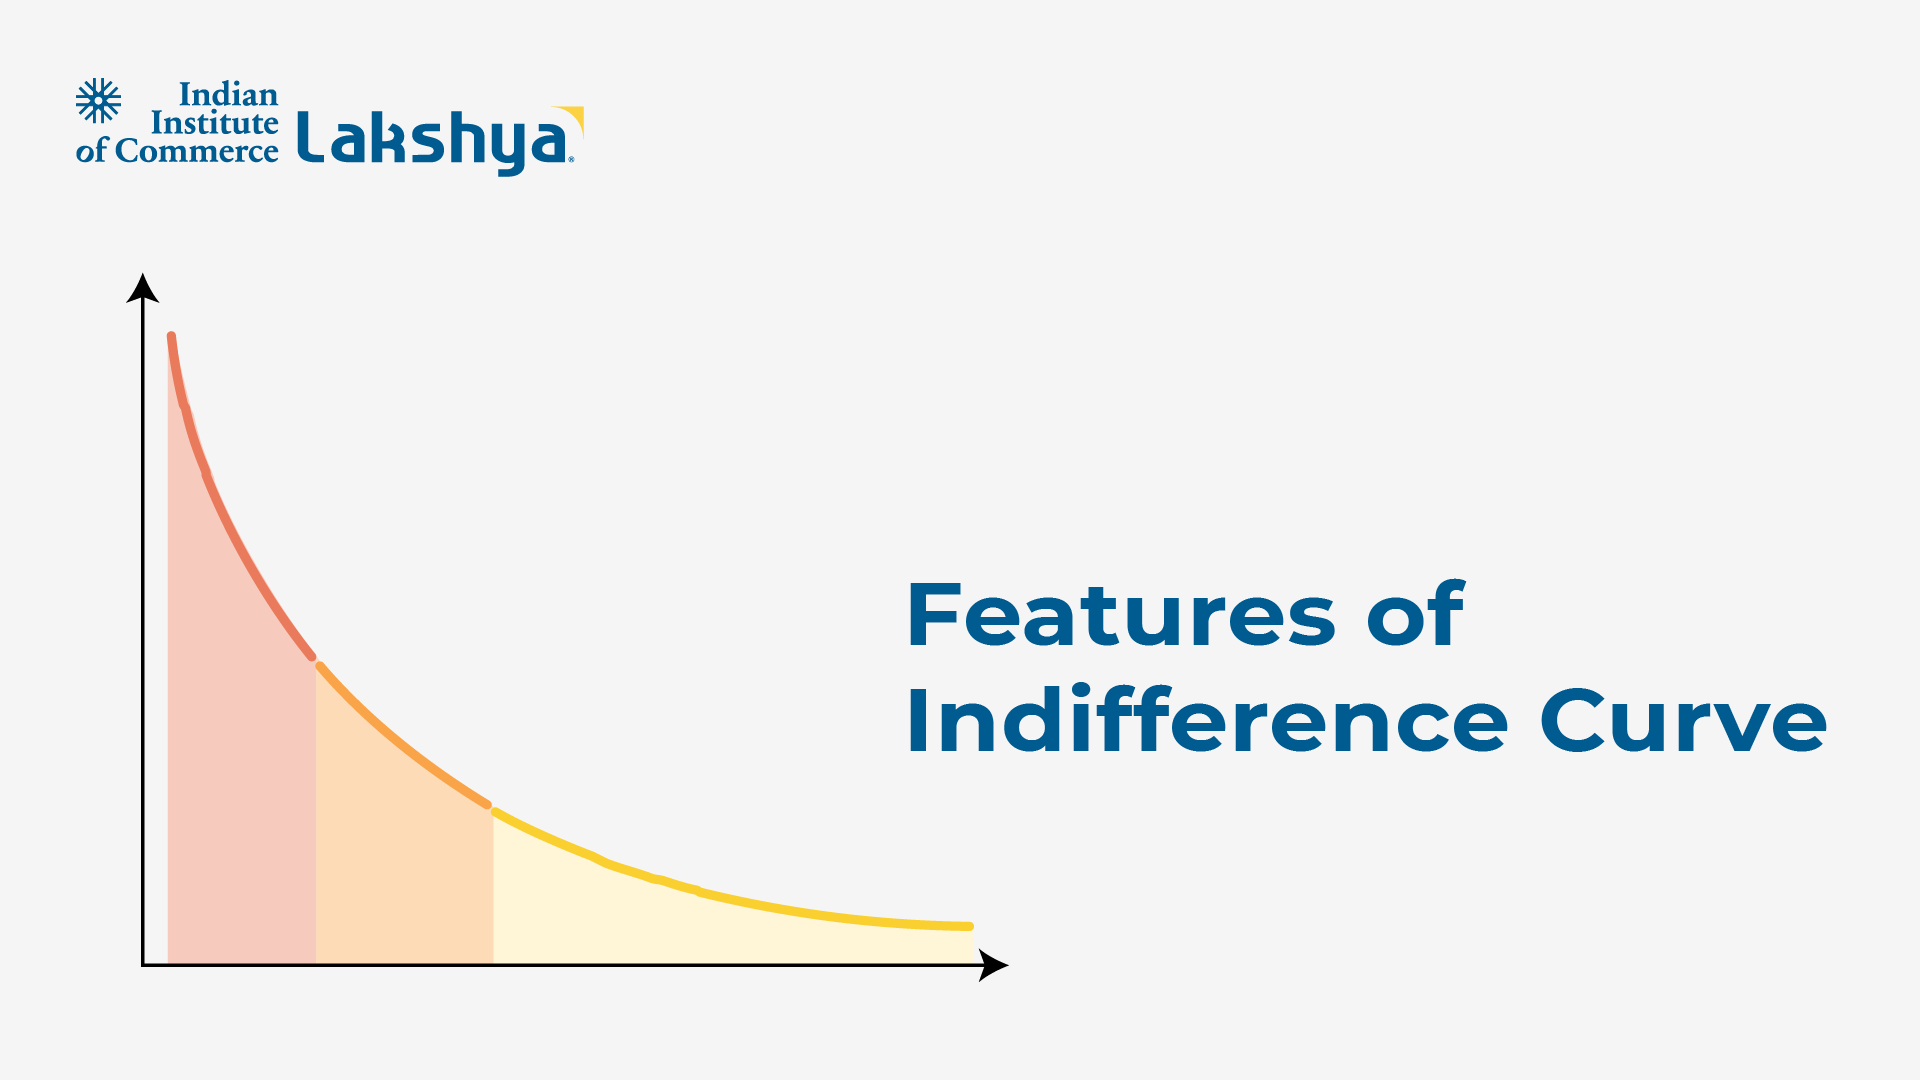
Key Features of Indifference Curves
The following are the main features of the theory, which show how a consumer might have to reject one good to get another. There might be a scenario where a consumer has to give up some of one good to get a larger portion of another good. For example, a child can be indifferent to four toys, two color pencils, and one comic book. Let’s explore the significant Indifference Curve features.
Downward-Sloping
This feature defines how an indifference curve has a negative slope as it goes from left to right on a downward bend. It reflects how a consumer must give up some of one good so that they can get more of another good.
This establishes and maintains a complete level of satisfaction and creates indifference among them. It also contributes to making further financial decisions both on individual and business levels.
Convex to the Origin
One of the key features of an indifference curve, convex to the origin, reflects that the indifference curve bows inward. It implies that a consumer is willing to sacrifice a lesser unit of one good if they get additional units of another good. This is due to the implementation of the law of diminishing marginal utility.
Higher Curves Represent Higher Utility
This feature indicates that a higher indifference curve represents a larger bundle of goods that is considered. Basically, the bundles are either a combination of higher units of both goods or more units of at least one good. It is also based on market prices and their changes.
Non-Intersection
There is a higher possibility that both indifference curves cannot intersect because the graph is two-dimensional. Every individual axis indicates one type of economic good in large quantities. However, if there is an intersection, then there might be a logical possibility that the same consumption bundle offers the same level of satisfaction.
Real-Life Examples of Indifference Curve
Below are real-life examples of an indifference curve and the way it functions. It reflects the consumer’s behavior, their choices and preferences of goods, the concept of costs, and the satisfaction levels from the goods and services.
Example 1: Burger vs. Coke
If you are placing a combo meal offer of a Burger and Coke at a restaurant, below are the combinations of the meal. If all these combinations give you the same level of satisfaction and happiness while consuming the meal, they all lie on the same indifference curve.
- 1 Burger and 2 Cokes
- 2 Burgers and 1 Coke
- 3 Burgers and 0 Coke
Example 2: Watching Netflix vs Study time
As a student, if you are combining the two activities, your study time and watching Netflix, the following are the combinations. If both scenarios bring you the same level of satisfaction, along with integrating productivity and relaxation balance, they are on the same indifference curve.
- 1.5 hours Netflix watch time + 1.5 hours study time
- 2 hours study time + 1 hour Netflix watch time
Significance of the Indifference Curve
A part of modern economic theory, the indifference curve is about understanding how consumers make their choices. Whether it is dependent on their income, change or rise in prices of goods in the market or the level of satisfaction the goods offer to the consumers. Let us explore the significance of the implementation and impact of the indifference curve.
Public policy - policymakers or economists use the indifference curve to evaluate utility and welfare programs, like rationing and subsidies
Pricing and marketing - both large-scale industries and small businesses use the indifference curve to understand consumer behavior and preferences, accordingly designing bundle offers
Demand theory - economists and market experts use the indifference curve to understand why demand changes and the way it is influenced by income or price change
Wrapping Up!
For any professional pursuing the Chartered Financial Analyst (CFA) designation, a deep understanding of consumer behavior is essential. The Indifference Curve (IC) is a cornerstone of microeconomic theory, providing a visual representation of how consumers make choices to maximize their utility within budget constraints. For students at IIC Lakshya, mastering this concept is vital for analyzing market efficiency and predicting how changes in income or pricing influence global consumption patterns.
Read More
- What is Monetary Policy? Types, Tools & Economic Impact
- Differences between Bookkeeping and Accounting Simplified!
- Exchange-Traded Funds: What They Are & How They Work
- Federal Reserve Bank: What It Is & Why It Matters
- What is Consumer Equilibrium?
Frequently Asked Questions on Indifference Curve
Why does IC slope downward in class 11?
The indifference curve (IC) slopes downward in class 11 because a consumer must give away some units to get more of another unit. This helps in establishing the same level of total satisfaction.
What are the uses of an indifference curve?
The indifference curves are evaluated based on microeconomics, which analyzes the consumer choice, preferences that determine the purchasing decisions, and understand the budget constraints. Additionally, the impact of price and income changes can be predicted based on consumption patterns.
What is cardinal and ordinal utility?
There are two economic theories, cardinal and ordinal utility measures consumer satisfaction. The cardinal utility assigns a specific numerical value to satisfaction. Ordinal utility reflects the ranks of preferences without any numbers.
Why is the IC curve convex?
An indifference curve or IC curve is convex to the origin due to the integration of the principle that reflects the diminishing marginal rate of substitution (MRS).
What is an indifference map?
A collection of indifference curves on a single graph that will represent different levels of consumer satisfaction. There is a basic combination of two goods reflecting the unique level of utility.
Related Articles


.webp)
.webp)
.webp)


.webp)

.webp)


.webp)
.webp)


.webp)


Learn Anytime, Anywhere, Download the Lakshya App.
Structured lessons, expert mentorship, and performance insights — built for serious commerce aspirants.

